Plinko edge bins versus the middle slots of a casino paytable
The two outer slots carry the biggest numbers on any Plinko paytable. Here is why they sit there, how rarely a ball reaches them, and what to open in a casino before you aim a bigger stake at them.
Open any Plinko tile in a casino lobby and the row of numbers along the bottom of the board tells most of the story: small figures in the middle, large ones at both ends. Those outer slots are the plinko edge bins, and they are priced high for a plain reason — the ball hardly ever gets there. Below is the counting behind that, one worked session, and the pages of a casino where the top payout and the account rules around it are written down.
Where plinko edge bins sit on the board
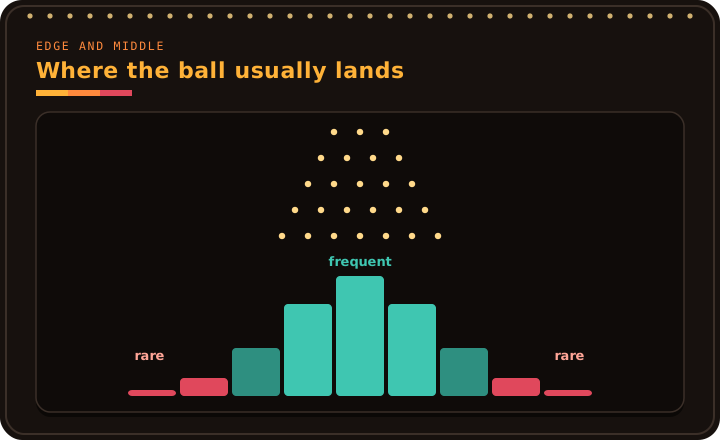
A board with n rows of pegs ends in n + 1 bins. At every peg the ball turns left or right, so the slot it finishes in depends only on how many of those turns went right. The centre can be reached through many different mixtures of lefts and rights. An edge slot needs every single turn to go the same way.
On an 8-row board there are 256 possible routes from the top peg to the floor. The centre bin collects 70 of them, and each edge bin collects exactly one. Stretch the board to 16 rows and the routes grow to 65,536: the centre takes 12,870 and each edge, once again, only one. The plinko casino sites comparison keeps that same board math in view alongside each casino's licence and withdrawal cap.
What to look for on the game screen
The slot count: it should equal the row count plus one. A panel set to 16 rows shows 17 slots.
Symmetry: the left and right ends normally print the same figure.
Colour: many games shade the outer slots in hotter tones, but the shading is decoration and says nothing about how often they land.
Why the middle pays back less than the stake
If the centre catches 70 of 256 routes on 8 rows, a game that paid more than the stake there would lose on its most common result. That is why the central slots on most paytables print a figure below 1×, and a ball landing there returns part of the bet rather than all of it.
The shape every board shares: most drops end near the middle, very few reach either edge. The bars show the shape only, not any game’s figures.
This is the part a player actually feels. Most drops finish near the middle, and most of those give back a little less than they took. The balance slides between the occasional landing further out. Nothing is wrong with the board when that happens; the paytable is working as designed.
One worked session of 500 drops
Here is the one sum worth doing before choosing a setting. Suppose you plan 500 drops at a fixed stake.
On 8 rows, the chance of reaching either edge on a single drop is 2 in 256, or 1 in 128. Across 500 drops, the chance of seeing at least one edge landing comes to about 98%.
On 16 rows, either edge is 2 in 65,536, or 1 in 32,768. Across the same 500 drops, the chance of even one edge landing shrinks to roughly 1.5%.
Same evening, same stake, same number of clicks: an edge landing is close to certain on the short board and close to impossible on the long one. The long board prints a far larger edge figure to make up for that. Whether the trade suits you is a budget question rather than a skill question, and the session budget guide covers how to size it.
How rows and risk reshape plinko edge bins
Two controls decide what the corners pay. The row count sets how far from the centre a ball can travel: more rows, rarer edges, bigger edge figures. The risk setting leaves the path of the ball untouched and loads a different paytable, usually lifting the outer figures and trimming the inner ones.
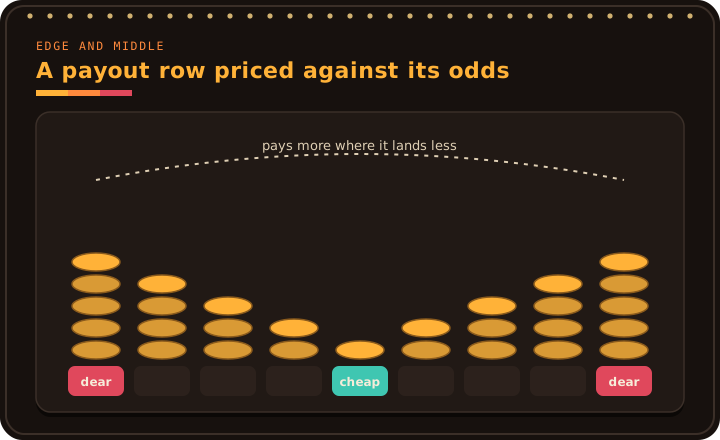
The payout row runs the other way round: the dearest bins sit at the edges the ball rarely reaches, the cheapest in the middle it reaches most. No figures are drawn because they belong to a specific build.
So a high-risk board with many rows is the sharpest version of the same trade. The corners print their largest values there and the middle prints its smallest. The rows and risk walk-through shows how the two controls sit next to each other on screen.
A made-up paytable to read, not to copy
Imagine an 8-row board printing 13× on each edge, 3× one step in, 1.3× the step after, 0.7× beside the centre and 0.4× in the centre itself. These numbers are an illustration only. A real game prints its own figures, and they differ between studios and settings. What matters is the shape: values climb gently as you move outward and then jump at the very last slot. For a slower tour of that bottom row, see reading the numbers under the pegs.
What the casino adds on top of the board
A large edge figure is a game number. How much of a big landing actually reaches your wallet, and in how many pieces, is settled somewhere else — in the casino's own terms. Before pointing a larger stake at the corners, open those terms and look for three lines.
A maximum bet per drop, often printed in the game's rules panel.
A maximum win per round or per bet, which some rules panels or terms set as a fixed sum.
A withdrawal cap per day, week or month, and whether large amounts are paid in instalments.
Vave writes the last point out plainly: its terms (cl. 8.8, 25 August 2026) set no cap per period, yet allow a win from 50,000 USDT to be paid, as an exception, in equal instalments. Other casinos print weekly or monthly ceilings instead, and the caps and instalments page lines them up.
A short check before chasing the corners
Count the slots and confirm the row setting you meant to pick.
Read the edge figure and the centre figure for that exact setting; both change the moment you touch either control.
Open the rules panel and search it for a max-win line.
Open the casino terms and find the withdrawal cap and any instalment clause.
Decide where the session stops before the first drop, not after the tenth miss.
The ball keeps no memory. A long run of centre landings does not bring an edge any closer, and an edge landing does not push the next one further away. Each drop starts counting again from the top peg. If you want to confirm that a particular drop was not altered after the fact, the seed check guide lists the steps.
Questions people actually type
Why do plinko edge bins pay so much more than the centre?
Because they are reached so rarely. On 8 rows only one route in 256 ends in each edge slot, while 70 routes end in the centre. A paytable has to balance those frequencies, so the rare result carries a large figure and the common one carries a small figure, usually below the stake. The exact values are set by the studio and change with the row and risk settings.
Does choosing more rows make an edge landing more likely?
No, the opposite. Each extra row doubles the number of routes while each edge still keeps a single route. On 8 rows either edge is 1 in 128 per drop; on 16 rows it is 1 in 32,768. The game compensates with a larger edge figure, which is why long boards feel quiet for long stretches and then occasionally pay a lot.
After many centre landings, is an edge hit due?
No. Every drop is independent: the ball does not know what happened on the previous one, and the odds for each slot stay the same from drop to drop. A long run without an edge landing is exactly what the path counts predict, especially on a 16-row board. Set your stake and stop point on that basis rather than on how long it has been since the last big number.